
Zero current
Identify strings with no current output when a generation reference is available.
SOLTHINGS / PV MONITORING & MAINTENANCE
Go from a plant overview to individual current, voltage and power readings. Find anomalies, review what happened and connect routine inspections with fault handling.
01 / UNDERSTAND YOUR SITE
Start with the plant overview, then switch to cards or topology to inspect the inverters and strings that need attention.
View string status and power distribution, compare power with irradiance and temperature trends, and check today’s energy, total energy and generation over the last 30 days.
Explore the plant, arrays and inverters step by step. Colors and status labels help locate areas that need attention.
Browse inverter cards by array to check health, string count and current power, and focus your inspections.
Review current, voltage, power, detection results and sampling times to guide on-site checks.
Filter by array, inverter, state, detection item and time range. Review event timestamps and export the list as CSV.
The overview, topology, device cards and string details show demo project data. The overview screenshot shows the Chinese interface. The fault list is an actual software screenshot in the selected language. Click any screenshot to enlarge; displayed values are not performance guarantees.
02 / FROM MEASUREMENTS TO INSIGHT
Detect electrical anomalies using current, voltage and comparisons within a group. Keep the evidence behind each result and show why a check is waiting when data is insufficient.
Enable the checks you need and set thresholds and anomaly/recovery confirmation times. Policies support plant, array and inverter levels.
Explore detection policiesIdentify strings with no current output when a generation reference is available.
Find strings whose current is substantially below the reference within their group.
Check whether voltage is outside the configured range during valid generation.
Identify valid negative current readings using the configured threshold.
Identify significant current differences between comparable strings.
Compare voltage deviation among valid inputs in the same group.
Compare string power when current and voltage measurements are synchronized.
After learning completes, identify strings that differ from their normal behavior.
03 / OPERATING ANALYSIS
MPPT deviation, environmental inputs and string grouping give power readings a reference and comparisons a meaningful basis.
01 / MPPT DEVIATION
View actual power, expected power and deviation for each MPPT channel. Configure it using module specifications and site wiring, then verify the environmental inputs.
Expected power is an estimate. Deviation is for observation and does not directly create faults or warnings.
Explore MPPT deviation02 / ENVIRONMENTAL INPUTS
Choose either online weather or on-site measurements. Map horizontal or plane-of-array irradiance, ambient and module temperatures, and other site measurements, with input unit conversion.
Online weather is model-based. Check the source, quality and time before use. Follow displayed reasons when diagnostics are unavailable.
Configure environmental inputs03 / STRING GROUPING
Create comparison groups by orientation, tilt, module configuration or shading. Graphical drag-and-drop, multi-selection and custom group names reflect real site differences in each comparison.
Configure comparison groups and MPPT channels separately. Ungrouped does not mean paused; use Ignore string to pause a string's detection.
Explore string comparison groups04 / SUPPORT EVERYDAY OPERATIONS
Turn operating data, environmental information and inspection records into practical evidence for daily work.
HISTORY & REPORTS
Query historical trends by device, measurement and time. Daily and weekly reports show observation coverage, connectivity and anomaly statistics, with CSV and PDF export.
Measurement history must be enabled in advance. Missing periods are not filled automatically.Explore history and reportsEDGEWEB
View devices, PV monitoring, history and fault records in a computer, tablet or phone browser, subject to configured access permissions.
Enable EdgeWeb, keep the desktop software running and ensure network connectivity.Explore browser access05 / USE CASES
For teams with access to inverter operating data who need local string monitoring and anomaly follow-up.
Organize inverters across rooftops into arrays, monitor string health centrally and prioritize inputs with recurring low current or persistent imbalance.
Locate an affected area in the plant topology, then drill down to inverters and strings. Use fault filters and handling records to follow issues over time.
Import a matching manufacturer template and check communications, data and status mapping. Validate policies under actual generating conditions and hand over a reusable monitoring project.
06 / GETTING STARTED
Create a project and communication channel, select a manufacturer/model template and check current, voltage, status and sampling.
Arrange inverters by site area, verify string counts and set comparison groups for comparable inputs.
Set checks, thresholds, confirmation times and status mapping. Connect environmental data where needed.
Enable the history you need, save the project and review live status, fault records and operating reports.
INVERTERS
Select a manufacturer and model to load its measurement configuration, reducing manual entry. The library includes residential, commercial and utility-scale models.
Equipment manufacturers
Individual model templates
HUAWEI
SUNGROW
GOODWE
GROWATT
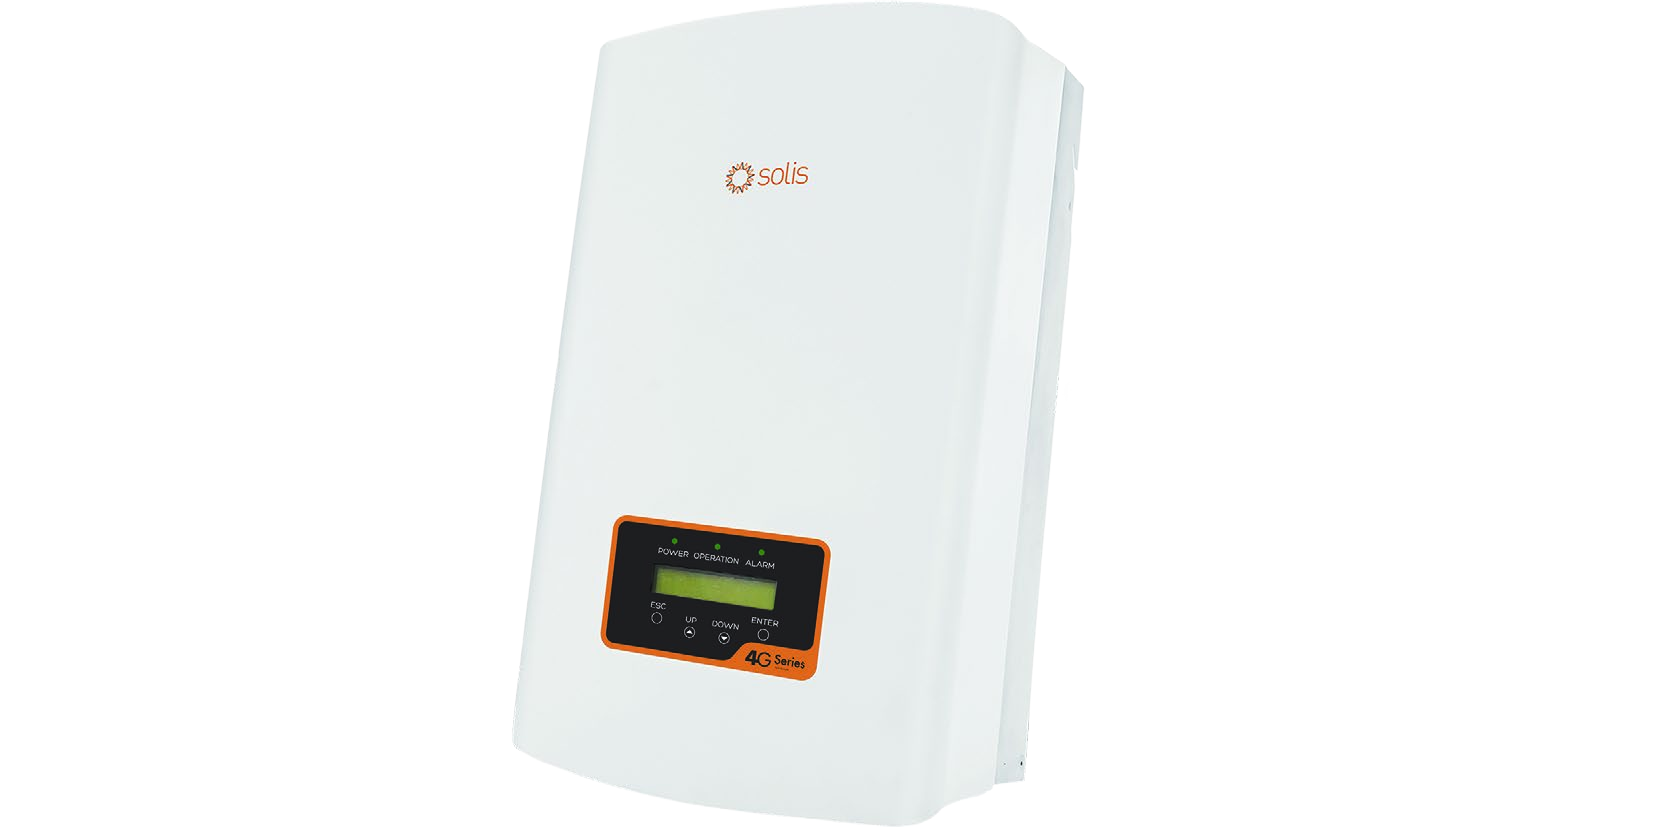
SOLIS
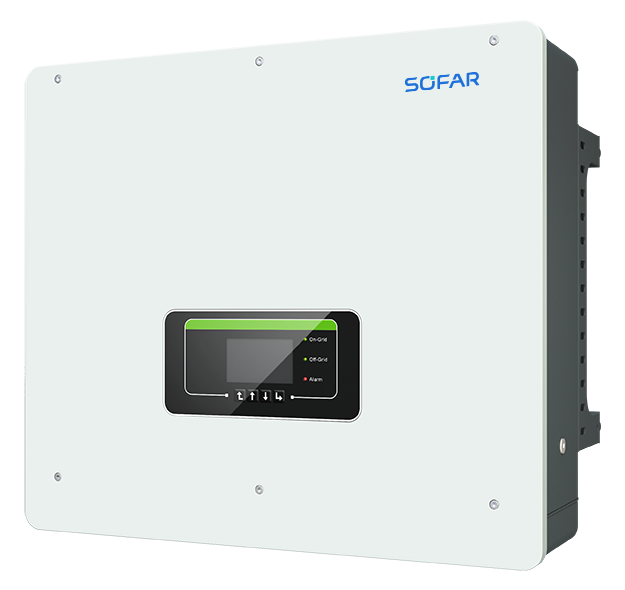
SOFAR
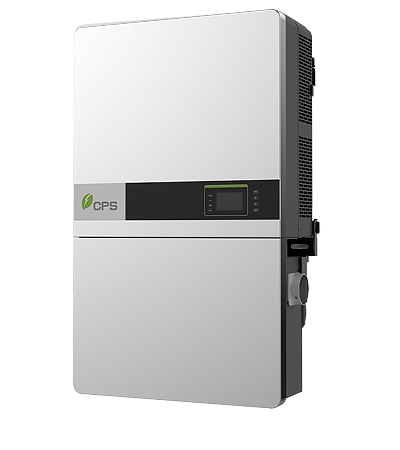
CHINT POWER
SMA SOLAR

Read through Sunny WebBox
View all 5 modelsThis is the current template library and includes some discontinued models. Available measurements and string monitoring depend on the model, protocol and firmware. MPPT or inverter totals cannot represent individual string data.
No matching model found. Try another search or contact us to check the device protocol and connection options.
PURCHASE
Personal Free, Commercial and Ground Station plans. Software use is perpetual. Technical support is optional, and an expired support term does not end your software license.
Scroll horizontally to compare all plans.
| Plan and scope | Personal FreePersonal learning and small projects | CommercialCommercial rooftops and distributed PV | Ground StationLarge ground-mounted and multi-array sites |
|---|---|---|---|
| License-only pricePaid technical support excluded | ¥0Free to use | ¥3,999One-time payment | ¥6,999One-time payment |
| Device limit | Up to 5 | Up to 100Total across all arrays | UnlimitedSuited to projects with over 100 devices |
| Arrays | 1 | Unlimited | Unlimited |
| PV strings | Unlimited | Unlimited | Unlimited |
| Software term | Perpetual | Perpetual | Perpetual |
| Activation | No certificate required | Machine-bound certificate | Machine-bound certificate |
| Self-service resources | User manual | User manual | User manual |
| Annual technical supportOptional, purchased separately | — | ¥2,000 / year | ¥3,000 / year |
| Lifetime technical supportOptional, one-time purchase | — | ¥20,000 | ¥30,000 |
TECHNICAL SUPPORT OPTIONS
The license-only option suits self-managed deployment using the manual. Commercial and Ground Station customers can add annual or lifetime technical support for remote installation and configuration guidance, device integration advice and troubleshooting.
Annual support covers the purchased service term. Lifetime support needs no annual renewal. Confirm the detailed scope when purchasing.
BEFORE YOU START
Key points about device selection, deployment and scope of use.
String monitoring requires valid current and voltage data for distinguishable inputs, plus device communication status. Each check has its own data, synchronization and reference requirements. MPPT or whole-inverter DC totals cannot reconstruct individual strings.
Local device communication, monitoring and recording work without internet access. Online weather needs a connection; connected on-site environmental measurements are an alternative. EdgeWeb uses your configured site network and requires the software to keep running.
Personal Free needs no certificate and can be used permanently with up to 5 devices, one array and unlimited strings. Commercial allows up to 100 devices; Ground Station has no device limit. Both paid editions allow unlimited arrays and strings. Paid perpetual licenses are machine-bound: provide the machine code under Help → License Management and import the certificate. No online renewal is required. Compare license scope, pricing and technical support.
The software provides anomaly indicators and records from operating data. Confirm causes using wiring checks, shading conditions, equipment documentation and field inspection. MPPT expected power is an estimate. The software does not replace I–V scanning, professional testing or certification.
Visible readings do not mean every check has sufficient inputs. Check sampling times, communication status, comparison groups and valid references. Learning-based checks must wait until the page shows learning is complete. String details and operating diagnostics show specific reasons.
TURN SITE DATA INTO MAINTENANCE EVIDENCE
Review the connection options, then prepare your project around the equipment models, communication conditions and monitoring scope on site.
For 64-bit Windows. See the user manual for installation and device connection steps.
Device connection · Project setup · Licensing · User guidance
mthings986@163.com